用strace跟踪malloc内存分配

strace是一个非常有用的命令,它用于记录和跟踪程序运行期间收到的信号和调用的系统调用。

strace的简单使用

1
2
3
4
5
6
7
8
9
10
11
12
13
14
ubuntu64:~$ strace cat /dev/null
execve("/bin/cat", ["cat", "/dev/null"], [/* 32 vars */]) = 0
brk(NULL) = 0x112e000
access("/etc/ld.so.nohwcap", F_OK) = -1 ENOENT (No such file or directory)
. . .
read(3, "", 131072) = 0
munmap(0x7f19a65be000, 139264) = 0
close(3) = 0
close(1) = 0
close(2) = 0
exit_group(0) = ?
+++ exited with 0 +++

每一行表示一个系统调用, 左边为系统调用的名称和参数, 右边为系统调用返回的结果。

参数

1
2
3
4
5
6
7
8
9
10
11
12
13
14
15
16
17
18
19
20
21
22
23
24
25
26
27
28
29
30
31
32
33
34
35
36
37
38
39
40
41
42
43
44
45
46
47
48
49
50
51
52
53
54
55
56
57
58
59
60
61
62
63
64
65
66
67
68
69
70
71
72
73
74
75
76
77
78
79
80
81
82
83
84
85
86
87
88
89
90
91
92
93
94
95
96
97
98
99
100
101
102
103
104
105
106
107
108
109
110
111
-c 统计每一系统调用的所执行的时间,次数和出错的次数等.
-d 输出strace关于标准错误的调试信息.
-f 跟踪由fork调用所产生的子进程.
-ff 如果提供-o filename,则所有进程的跟踪结果输出到相应的filename.pid中,pid是各进程的进程号.
-F 尝试跟踪vfork调用.在-f时,vfork不被跟踪.
-h 输出简要的帮助信息.
-i 输出系统调用的入口指针.
-q 禁止输出关于脱离的消息.
-r 打印出相对时间关于,,每一个系统调用.
-t 在输出中的每一行前加上时间信息.
-tt 在输出中的每一行前加上时间信息,微秒级.
-ttt 微秒级输出,以秒了表示时间.
-T 显示每一调用所耗的时间.
-v 输出所有的系统调用.一些调用关于环境变量,状态,输入输出等调用由于使用频繁,默认不输出.
-V 输出strace的版本信息.
-x 以十六进制形式输出非标准字符串
-xx 所有字符串以十六进制形式输出.
-a column
设置返回值的输出位置.默认 为40.
-e expr
指定一个表达式,用来控制如何跟踪.格式如下:
[qualifier=][!]value1[,value2]...
qualifier只能是 trace,abbrev,verbose,raw,signal,read,write其中之一.value是用来限定的符号或数字.默认的 qualifier是 trace.感叹号是否定符号.例如:
-eopen等价于 -e trace=open,表示只跟踪open调用.而-etrace!=open表示跟踪除了open以外的其他调用.有两个特殊的符号 all 和 none.
注意有些shell使用!来执行历史记录里的命令,所以要使用\\.
-e trace=set
只跟踪指定的系统 调用.例如:-e trace=open,close,rean,write表示只跟踪这四个系统调用.默认的为set=all.
-e trace=file
只跟踪有关文件操作的系统调用.
-e trace=process
只跟踪有关进程控制的系统调用.
-e trace=network
跟踪与网络有关的所有系统调用.
-e strace=signal
跟踪所有与系统信号有关的 系统调用
-e trace=ipc
跟踪所有与进程通讯有关的系统调用
-e abbrev=set
设定 strace输出的系统调用的结果集.-v 等与 abbrev=none.默认为abbrev=all.
-e raw=set
将指 定的系统调用的参数以十六进制显示.
-e signal=set
指定跟踪的系统信号.默认为all.如 signal=!SIGIO(或者signal=!io),表示不跟踪SIGIO信号.
-e read=set
输出从指定文件中读出 的数据.例如:
-e read=3,5
-e write=set
输出写入到指定文件中的数据.
-o filename
将strace的输出写入文件filename
-p pid
跟踪指定的进程pid.
-s strsize
指定输出的字符串的最大长度.默认为32.文件名一直全部输出.
-u username
以username 的UID和GID执行被跟踪的命令

用strace查看malloc内存分配

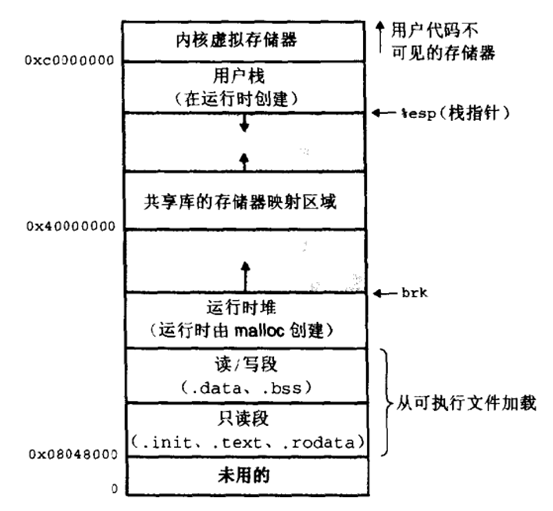
我在博客中曾经提到过malloc采用了两中不同的方式来处理内存申请:

  • 若分配内存小于 128k,调用 sbrk(),将堆顶指针向高地址移动,获得新的虚存空间。
  • 若分配内存大于 128k,调用 mmap(),在文件映射区域中分配匿名虚存空间。

现在我们就strace 跟踪在那篇博客中的 Case #3, 在这之前我先修改 Case #3的代码,添加代码(完整的代码在博客尾部):

1
2
3
int *list;
list = malloc(1024*1024);
free(list);

这段代码用于查看当申请的内存大于128k时, malloc的处理方法。
strace 跟踪结果如下:

1
2
3
4
5
6
7
8
9
10
11
12
13
14
15
16
17
18
19
20
21
22
23
24
25
26
27
28
29
30
31
32
ubuntu64:~$ strace ./test_mem
execve("./test_mem", ["./test_mem"], [/* 32 vars */]) = 0
. . .
brk(0xd0e000) = 0xd0e000 //通过将堆顶向高地址移动到0xd0e000为进程分配内存
write(1, "before malloc, the top of heap i"..., 43before malloc, the top of heap is 0xced000) = 43
write(1, "address of a is 0xced420 top of "..., 62address of a is 0xced420 top of heap after malloc is 0xd0e000) = 62
brk(0xd40000) = 0xd40000 // 同样通过移动堆顶分配内存
write(1, "address of a is 0xd06430 top of "..., 62address of a is 0xd06430 top of heap after malloc is 0xd40000) = 62
write(1, "address of a is 0xd1f440 top of "..., 62address of a is 0xd1f440 top of heap after malloc is 0xd40000) = 62
brk(0xd72000) = 0xd72000 // 同样通过移动堆顶分配内存
write(1, "address of a is 0xd38450 top of "..., 62address of a is 0xd38450 top of heap after malloc is 0xd72000) = 62
write(1, "address of a is 0xd51460 top of "..., 62address of a is 0xd51460 top of heap after malloc is 0xd72000) = 62
brk(0xda4000) = 0xda4000 // 同样通过移动堆顶分配内存
write(1, "address of a is 0xd6a470 top of "..., 62address of a is 0xd6a470 top of heap after malloc is 0xda4000) = 62
write(1, "address of a is 0xd83480 top of "..., 62address of a is 0xd83480 top of heap after malloc is 0xda4000) = 62
brk(0xdd6000) = 0xdd6000 // 同样通过移动堆顶分配内存
write(1, "address of a is 0xd9c490 top of "..., 62address of a is 0xd9c490 top of heap after malloc is 0xdd6000) = 62
write(1, "address of a is 0xdb54a0 top of "..., 62address of a is 0xdb54a0 top of heap after malloc is 0xdd6000) = 62
brk(0xe08000) = 0xe08000 // 同样通过移动堆顶分配内存
write(1, "address of a is 0xdce4b0 top of "..., 62address of a is 0xdce4b0 top of heap after malloc is 0xe08000) = 62
//用mmap在文件映射区为进程分配内存
mmap(NULL, 1052672, PROT_READ|PROT_WRITE, MAP_PRIVATE|MAP_ANONYMOUS, -1, 0) = 0x7f0cd5140000
write(1, "malloc end\n", 11malloc end) = 11
write(1, "before free, the top of heap is "..., 41before free, the top of heap is 0xe08000) = 41
brk(0xd0e000) = 0xd0e000 //释放通过brk移动堆顶分配的内存
write(1, "after free, the top of heap is "..., 41after free, the top of heap is 0xd0e000) = 41
munmap(0x7f0cd5140000, 1052672) = 0 //释放mmap分配的内存
exit_group(0) = ?
+++ exited with 0 +++
结果中省略了程序加载部分内容,从输出结果可以看出:

  1. 在为链表申请节点时, 因为每个节点size小于128k(128k是可以调整的), malloc直接通过brk()函数在堆上分配内存。

  2. 为list分配内存时,因为它需要1M内存, 所以malloc通过mmap()函数在在文件映射区域分配内存。

附录

1. 32位系统中进程虚拟空间布局

内存布局

2. Case #3代码

1
2
3
4
5
6
7
8
9
10
11
12
13
14
15
16
17
18
19
20
21
22
23
24
25
26
27
28
29
30
31
32
33
34
35
36
37
38
39
40
41
42
43
44
45
46
47
48
#include <stdio.h>
#include <stdlib.h>
#include <string.h>
#include <unistd.h>
typedef struct node
{
char a[1024*100];
struct node *next;
}node;
int main()
{
node *node_first = NULL, *node_now;
node *a;
int i;
char s_cmd[100];
sprintf(s_cmd, "pmap -d %lu | grep mapped", getpid());
printf("before malloc, the top of heap is 0x%lx\n", sbrk(0));
for(i=0;i<10;i++){
a=(node *)malloc(sizeof(node));
a->next=NULL;
if(node_first==NULL) node_first=a;
else node_now->next=a;
node_now=a;
printf("address of a is 0x%lx ", a);
printf("top of heap after malloc is 0x%lx\n", sbrk(0));
}
int *list;
list = malloc(1024*1024);
printf("malloc end\n");
printf("before free, the top of heap is 0x%lx\n", sbrk(0));
while(node_first!=NULL)
{
node_now=node_first->next;
free(node_first);
node_first=node_now;
}
printf("after free, the top of heap is 0x%lx\n", sbrk(0));
free(list);
return 0;
}

参考

[1] Linux strace命令
[2] strace